

Investing in cryptocurrencies comes with significant risk. You could lose all the money you invest. Please read our risk warning here.
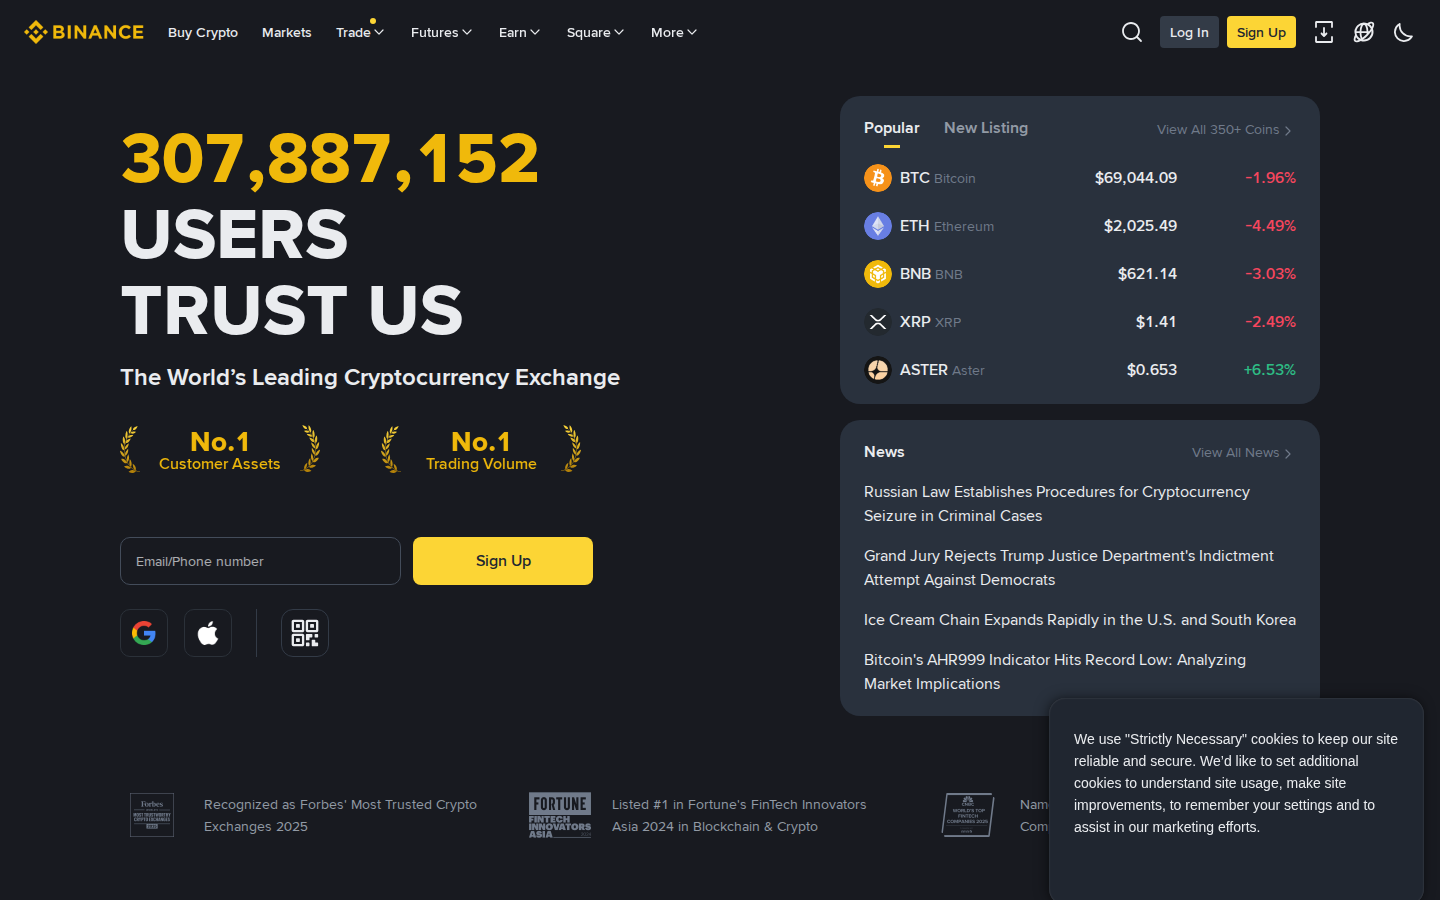
Binance is the world's largest cryptocurrency exchange by daily trading volume, serving over 300 million registered users across 180+ countries. Founded in 2017 by Changpeng Zhao (CZ), the platform processed $34 trillion in trading volume during 2025 alone. Binance offers spot, margin, futures, and options trading alongside a comprehensive Web3 ecosystem including staking, an NFT marketplace, Launchpad, and a self-custody wallet. In this Binance review for 2026, we break down its fees, security features, regulatory standing, and usability to help you decide whether it is the right exchange for your needs.
Overall Rating: 4.5/5 ⭐⭐⭐⭐½
| Category | Rating | Summary |
|---|---|---|
| Fees & Pricing | ⭐⭐⭐⭐⭐ 5/5 | Industry-leading low fees (0.1%) |
| Security | ⭐⭐⭐⭐ 4/5 | Strong (SAFU fund, PoR) but past issues |
| Ease of Use | ⭐⭐⭐⭐ 4/5 | Powerful but complex for beginners |
| Crypto Selection | ⭐⭐⭐⭐⭐ 5/5 | 700+ coins, 3,400+ pairs - unmatched |
| Staking & Rewards | ⭐⭐⭐⭐⭐ 5/5 | Comprehensive earn suite, Launchpool |
| Customer Support | ⭐⭐⭐ 3/5 | No phone support, chat only |
Last updated: February 11, 2026. We independently research all platforms we review.
Binance at a Glance
| Feature | Details |
|---|---|
| Founded | 2017 |
| CEO | Richard Teng (since November 2023) |
| Registered Users | 300+ million |
| 2025 Trading Volume | $34 trillion |
| Supported Countries | 180+ |
| Supported Cryptocurrencies | 700+ coins, 3,400+ trading pairs |
| Spot Trading Fees | 0.10% maker / 0.10% taker (25% off with BNB) |
| Futures Trading Fees | 0.02% maker / 0.05% taker |
| Deposit Fees | Free for crypto; varies for fiat |
| Security | 2FA, cold storage, $1B SAFU fund (converting to BTC), Proof of Reserves |
| User Asset Reserves | $163 billion fully backed (end of 2025) |
| Mobile App | iOS and Android (full feature parity) |
| Regulation | ADGM global license, France AMF, Dubai VARA, Japan, 20+ jurisdictions |
What Is Binance?
Binance is a centralized cryptocurrency exchange that supports both crypto-to-crypto and fiat-to-crypto trading. It was launched in July 2017 after a $15 million ICO and became the dominant exchange by volume within six months. The platform operates its global headquarters from Abu Dhabi under a full ADGM license (effective January 5, 2026) and maintains regional entities licensed in multiple jurisdictions including France (AMF-registered), Dubai (VARA), Japan, Spain, Italy, Sweden, Poland, Lithuania, and Bahrain.
CZ stepped down as CEO in November 2023 as part of a $4.3 billion settlement with the U.S. Department of Justice over compliance violations. Richard Teng, a former Abu Dhabi financial regulator, now leads the company. Under Teng's leadership, Binance has aggressively pursued regulatory compliance, becoming the first crypto exchange to secure a global license under the ADGM framework in December 2025. The exchange grew from 270 million to over 300 million users during 2025 alone.
Beyond basic trading, Binance has evolved into a full Web3 ecosystem encompassing Binance Earn (staking and savings), Binance Launchpool and Launchpad, an NFT marketplace, Binance Pay, the BNB Chain blockchain, a Web3 self-custody wallet supporting 130+ chains, and Binance Square (a social content platform). This makes Binance far more than just an exchange -- it is a comprehensive crypto financial infrastructure platform.
Key Features
Trading Options
Binance offers the widest range of trading products of any centralized exchange in 2026. Spot trading supports 700+ cryptocurrencies with 3,400+ trading pairs, while the futures platform offers perpetual and quarterly contracts with up to 125x leverage on select pairs. Margin trading supports both cross and isolated margin modes across hundreds of pairs.
Additional trading features include:
- Options trading -- European-style options on BTC and ETH with flexible strike prices and expiry dates
- Copy trading -- Follow and replicate top traders' strategies automatically with customizable risk controls
- Trading bots -- Grid, DCA, rebalancing, and arbitrage bots built directly into the platform
- P2P trading -- Buy and sell crypto directly with other users using 300+ local payment methods across 100+ currencies
- Convert -- Zero-fee instant swaps between supported tokens, ideal for quick conversions
- Demo trading -- Practice with virtual funds before committing real capital
- Binance Alpha -- Early access to promising tokens and projects before they are officially listed
Binance Earn
Binance Earn is the platform's passive income hub, offering multiple ways to generate yield on crypto holdings. It is one of the most comprehensive earn suites in the industry:
- Simple Earn -- Flexible savings (withdraw anytime) and locked products with variable APY across 300+ assets
- ETH Staking -- Stake ETH and receive BETH/WBETH tokens representing your staked position
- BNB Vault -- Aggregate BNB yield from multiple sources including Launchpool, savings, and DeFi staking
- Launchpool -- Stake BNB or other tokens to farm new token launches before they hit the market
- Dual Investment -- Structured products for advanced yield strategies with predefined settlement dates
- Auto-Invest -- Dollar-cost averaging with automatic recurring purchases on a flexible schedule
- Smart Arbitrage -- Higher-risk advanced earn product that exploits funding rate differentials
Binance Launchpad and Launchpool
Binance Launchpad is the exchange's token launch platform, giving users early access to new cryptocurrency projects through token sales. Since its inception, Launchpad has hosted dozens of successful launches. The vetting process by Binance's listing team significantly reduces the risk of scam projects compared to standalone ICOs.
Launchpool works differently: users stake BNB, FDUSD, or other specified tokens into pools to farm new project tokens over a set period. Staked assets can be withdrawn at any time. This offers a low-risk way to gain exposure to new tokens without purchasing them directly. Binance Megadrop combines Launchpool staking with Web3 quest completion for additional airdrop rewards.
BNB Token Benefits
BNB (Build and Build) is Binance's native token and offers tangible platform benefits. Paying trading fees with BNB provides a 25% discount on spot and margin trading. BNB also powers the BNB Chain ecosystem (one of the largest smart contract platforms by TVL), is required for Launchpool participation, and can be staked for additional yield. As of early 2026, BNB consistently ranks among the top 5 cryptocurrencies by market capitalization.
Web3 Wallet
The Binance Web3 Wallet is a self-custody wallet built into the Binance mobile app. Instead of traditional seed phrases, it uses Multi-Party Computation (MPC) technology for enhanced security. The wallet supports 130+ blockchain networks including Ethereum, BNB Chain, Polygon, Arbitrum, Solana, and more. Through the wallet, users can access DeFi protocols, NFT marketplaces, GameFi applications, and claim airdrops -- all without leaving the Binance ecosystem.
Binance Fees
Binance is one of the cheapest major exchanges for trading in 2026. Spot trading fees start at 0.10% for both makers and takers at the Regular (VIP 0) tier. This base rate decreases as your 30-day trading volume or BNB holdings increase, reaching as low as 0.012% maker / 0.024% taker at VIP 9 ($4B+ monthly volume).
| Fee Type | Standard Rate | With BNB Discount |
|---|---|---|
| Spot Maker | 0.10% | 0.075% |
| Spot Taker | 0.10% | 0.075% |
| Futures Maker (USDT-M) | 0.02% | 0.015% |
| Futures Taker (USDT-M) | 0.05% | 0.0375% |
| Options Maker | 0.02% | 0.015% |
| Options Taker | 0.02% | 0.015% |
| Crypto Deposits | Free | Free |
| Crypto Withdrawals | Network-dependent (e.g., ~0.0002 BTC) | -- |
| Credit/Debit Card Purchase | 1.8%--2% | -- |
| P2P Trading | Free (maker); taker fees vary | -- |
| Convert (Instant Swap) | 0% (spread included) | -- |
In January 2026, Binance updated its fee policy for select FDUSD trading pairs: maker fees remain zero on BTC/FDUSD, BNB/FDUSD, ETH/FDUSD, SOL/FDUSD, DOGE/FDUSD, LINK/FDUSD, and XRP/FDUSD pairs, while standard taker fees now apply. This makes FDUSD pairs particularly attractive for limit-order traders.
How Binance Fees Compare
Compared to Coinbase (0.40%--0.60% on Simple Trade), Kraken (0.16%--0.26% spot), or Crypto.com (0.075%--0.15%), Binance's 0.10% base fee is among the lowest available. For a trader executing $10,000 in monthly volume, the annual fee savings versus Coinbase Simple Trade amounts to roughly $360--$600.
Tips to Reduce Binance Fees
- Pay fees in BNB for an automatic 25% discount on spot and margin trades
- Increase your 30-day trading volume or BNB holdings to climb VIP tiers
- Use limit orders (maker) rather than market orders (taker) when possible
- Trade FDUSD pairs for zero maker fees on select assets
- Choose cheaper withdrawal networks (e.g., BNB Chain or Polygon instead of Ethereum mainnet)
Security and Safety
Binance is one of the most secure cryptocurrency exchanges in 2026. The platform has invested heavily in security infrastructure, particularly after the May 2019 incident when hackers stole 7,000 BTC ($40 million at the time) from hot wallets. Binance covered all losses from its SAFU fund and overhauled its entire security stack.
SAFU Fund (Secure Asset Fund for Users)
The SAFU is Binance's $1 billion emergency insurance fund, established in July 2018 and funded by allocating 10% of all spot trading fees. In February 2026, Binance announced plans to convert the entire SAFU reserve from stablecoins (USDC) into Bitcoin over 30 days, reflecting its belief that BTC represents long-term value as the core crypto asset. The exchange has committed to rebalancing the fund back to $1 billion if Bitcoin price fluctuations cause it to fall below $800 million.
Proof of Reserves
Binance publishes regular Proof of Reserves (PoR) audits using Merkle tree technology and zk-SNARKs (zero-knowledge proofs). By the end of 2025, Binance's PoR showed user assets of approximately $163 billion fully backed across 45 crypto assets. This level of transparency is unmatched by most competitors.
Security Measures
- Cold Storage -- The majority of user funds are stored offline in air-gapped cold wallets
- Two-Factor Authentication (2FA) -- Support for Google Authenticator, SMS, email, passkeys, and hardware security keys (YubiKey)
- Anti-Phishing Code -- Custom code displayed in all official Binance emails to prevent phishing attacks
- Address Whitelisting -- Restrict withdrawals to pre-approved wallet addresses only
- Real-Time AI Monitoring -- AI-powered risk management system that detects and flags suspicious activity
- Withdrawal Cooling Period -- 24--48 hour hold on withdrawals when suspicious activity is detected
- CCSS Compliance -- Adheres to the Cryptocurrency Security Standard, an internationally recommended framework
User Protection Track Record
In 2025, Binance recovered $48 million across 38,648 cases of incorrect deposits, bringing cumulative recoveries to over $1 billion. The exchange helped 5.4 million users identify potential risks, preventing approximately $6.7 billion in scam-related losses. Binance also collaborated with global law enforcement, leading to the confiscation of $131 million in illicit funds. Since the 2019 breach, Binance has not suffered another major security incident.
Supported Cryptocurrencies
Binance supports over 700 cryptocurrencies and 3,400+ trading pairs, making it one of the widest selections among major exchanges. This includes all major assets (BTC, ETH, BNB, SOL, XRP, ADA, DOGE, AVAX, DOT, MATIC) plus hundreds of mid-cap and small-cap altcoins. New tokens are regularly added through Binance's listing process, Launchpool events, and the Binance Alpha program.
The platform supports 30+ fiat currencies for deposits and 100+ for purchasing crypto. Fiat on-ramps include:
- Bank transfers (SEPA, SWIFT, Faster Payments, ACH for Binance.US)
- Credit and debit cards (Visa, Mastercard)
- Apple Pay and Google Pay
- P2P trading with 300+ local payment methods
- Third-party payment providers (Simplex, Banxa, and others)
User Experience and Interface
Binance offers two interface modes to accommodate different experience levels. The "Lite" mode provides a simplified view for beginners with basic buy/sell functionality, portfolio overview, market prices, and quick Convert access. The "Pro" mode delivers TradingView-powered charting, advanced order types (limit, stop-limit, OCO, trailing stop), depth charts, and fully customizable layouts.
The learning curve is steeper than beginner-focused platforms like Coinbase or Crypto.com. However, once familiar with the layout, the platform is highly capable and responsive. Binance Academy provides extensive free educational resources, and Binance Square offers community-driven content to help new users learn trading strategies.
Mobile App
The Binance mobile app (iOS and Android) maintains full feature parity with the desktop version. It supports spot, margin, and futures trading, Binance Earn products, P2P trading, the NFT marketplace, and the Web3 wallet -- all from your phone. The app consistently ranks among the highest-rated crypto exchange apps on both app stores.
Notable app features include biometric login (Face ID, fingerprint), push notifications for price alerts and order fills, customizable home screen widgets, and a built-in portfolio tracker. Performance remains smooth even during high-volatility events, which is critical for active traders who need reliable execution.
Customer Support
Customer support has historically been one of Binance's weaker areas, though the exchange has made significant improvements. Current support channels include:
- 24/7 Live Chat -- Available in the app and on the website with both AI chatbot and human agents
- Help Center -- Comprehensive knowledge base with guides, tutorials, and troubleshooting articles
- Community Forums -- Active Binance Square community and regional Telegram groups
- VIP Support -- Priority support with dedicated account managers for high-volume VIP users
- Email Support -- Available for complex issues requiring documentation
There is no phone support, which remains a disadvantage compared to Kraken (which offers 24/7 phone support). User reviews on Trustpilot remain mixed, with account verification delays and withdrawal processing times being the most common complaints. However, the exchange has expanded its support team significantly and response times have generally improved.
Regulatory Status
Binance's regulatory trajectory has shifted dramatically from controversial to compliance-first under Richard Teng's leadership. The exchange now holds licenses or registrations in 20+ jurisdictions, making it one of the most widely regulated crypto platforms globally.
Key Regulatory Milestones
| Jurisdiction | Status | Regulator |
|---|---|---|
| Abu Dhabi (ADGM) | Full global license (effective Jan 5, 2026) | FSRA |
| Dubai | VASP license | VARA |
| France | Digital Asset Service Provider | AMF |
| Japan | Licensed (via SEBC subsidiary) | FSA |
| Italy | CASP framework under Consob | Consob |
| Spain | Registered | Bank of Spain |
| Sweden, Poland, Lithuania | Registered | Local regulators |
| Bahrain | Licensed | CBB |
| United States | Binance.US (separate entity, under monitoring) | DOJ/FinCEN oversight |
The December 2025 ADGM global license was a landmark achievement -- Binance became the first crypto exchange to secure a global license under the ADGM framework, enabling regulated exchange, clearing, and brokerage services from Abu Dhabi. This significantly strengthened Binance's institutional credibility.
Binance.US
U.S. residents cannot access the global Binance.com platform and must use Binance.US, which operates as a separate legal entity. In early 2026, Binance.US restored USD deposit and withdrawal services after nearly two years as a crypto-only platform, and introduced zero-fee trading on select crypto-to-USD pairs. However, Binance.US still offers a reduced feature set with fewer trading pairs, no futures or margin trading, and remains under enhanced DOJ/FinCEN compliance monitoring.
Binance NFT Marketplace
The Binance NFT Marketplace allows users to buy, sell, bid on, and mint NFTs with a low 1% platform fee -- significantly cheaper than most competitors. It supports multiple blockchains including BNB Chain and Ethereum, helping reduce gas costs (especially for BNB Chain minting). The marketplace features Mystery Boxes, Initial Game Offerings (IGOs), and creator royalties. For existing Binance users, the seamless ecosystem integration makes it a convenient entry point into NFTs.
Binance vs Competitors
| Feature | Binance | Coinbase | Kraken | Bybit |
|---|---|---|---|---|
| Spot Fees (Maker/Taker) | 0.10% / 0.10% | 0.40% / 0.60% | 0.16% / 0.26% | 0.10% / 0.10% |
| Futures Fees | 0.02% / 0.05% | N/A | 0.02% / 0.05% | 0.02% / 0.055% |
| Supported Coins | 700+ | 250+ | 300+ | 500+ |
| Registered Users | 300M+ | 110M+ | 13M+ | 60M+ |
| 2025 Trading Volume | $34 trillion | ~$1.2 trillion | ~$700B | ~$8 trillion |
| Max Leverage | 125x | N/A | 50x | 100x |
| Staking/Earn | Comprehensive suite | Yes (limited) | Yes | Yes |
| U.S. Available | Binance.US only (limited) | Yes (full) | Yes (full) | No |
| Insurance Fund | $1B SAFU | FDIC (fiat only) | None public | $300M+ |
| Proof of Reserves | $163B verified | Public company (audited) | Yes | Yes |
| Beginner Friendly | Moderate | Excellent | Good | Moderate |
For detailed head-to-head comparisons, see our guides on Coinbase vs Binance, Kraken vs Binance, and Binance vs Crypto.com.
Pros and Cons
| Pros | Cons |
|---|---|
| Lowest fees among major exchanges (0.10% spot, zero maker on FDUSD pairs) | Not fully available to U.S. users |
| 700+ supported cryptocurrencies and 3,400+ trading pairs | Steep learning curve for complete beginners |
| Comprehensive trading: spot, futures (125x), options, copy trading, bots | Mixed customer support reviews on Trustpilot |
| $1 billion SAFU insurance fund with transparent Proof of Reserves ($163B) | $4.3B DOJ settlement history (2023) |
| 300+ million users providing unmatched liquidity | Complex interface can feel overwhelming initially |
| BNB discount reduces fees by 25% | Certain features restricted by region |
| Full-featured mobile app with Web3 wallet (130+ chains) | No phone support available |
| Extensive earn suite: staking, savings, Launchpool, auto-invest | Occasional withdrawal delays during peak periods |
| ADGM global license and 20+ regulatory registrations | Binance.US has very limited features compared to global platform |
Our Review Methodology
Our Binance review is based on hands-on testing and comprehensive research:
- Account testing: We maintain active accounts on Binance to verify features and user experience.
- Fee verification: We documented current fee schedules and tested actual trading costs.
- Security assessment: We verified SAFU fund status, Proof of Reserves data, and regulatory licenses.
- Feature testing: We reviewed spot, futures, earn products, and the Web3 wallet functionality.
- Competitor comparison: We benchmarked Binance against Coinbase, Kraken, Bybit, and other major exchanges.
- Community feedback: We analysed Trustpilot reviews, app store ratings, and user discussions.
Bitcompare maintains editorial independence. Where affiliate links are present, they do not affect our ratings or recommendations.
Who Should Use Binance?
Binance is best for intermediate to advanced traders who want the widest selection of trading products, the lowest possible fees, and access to high-leverage derivatives. It is also excellent for crypto investors seeking passive income through staking, savings, Launchpool, and auto-invest products.
Choose Binance if you:
- Want the lowest trading fees among major exchanges (0.10% or less with BNB)
- Need access to 700+ cryptocurrencies and 3,400+ trading pairs
- Trade futures or options and want up to 125x leverage
- Want a comprehensive ecosystem (earn, NFTs, Web3 wallet, P2P, Launchpad)
- Value transparent reserves ($163B verified) and a $1B insurance fund
- Are based outside the U.S. or are comfortable with Binance.US limitations
Consider alternatives if you:
- Are a complete beginner -- Coinbase offers a simpler, more intuitive experience
- Are a U.S. resident wanting full features -- Kraken or Coinbase provide a more complete U.S. experience
- Want the strongest regulatory standing -- Coinbase (NASDAQ-listed) or Gemini (SOC 2 certified)
- Prefer phone-based customer support -- Kraken offers 24/7 phone support
- Want a privacy-focused exchange with no KYC -- consider decentralized exchanges instead
Binance Alternatives
If Binance is not the right fit, consider these alternatives available on Bitcompare:
- Coinbase -- Best for beginners and U.S. users; NASDAQ-listed, strong regulation, simple interface
- Kraken -- Excellent security track record, 24/7 phone support, good for U.S. and EU users
- Bybit -- Similar fee structure with strong derivatives and copy trading features
- KuCoin -- Wide altcoin selection, good for discovering new and emerging tokens
- OKX -- Comprehensive Web3 wallet and DeFi integration with competitive fees
- Bitget -- Strong copy trading platform with competitive derivatives fees
For a full breakdown, see our Binance alternatives guide and use our exchange comparison tool to compare fees side by side.
Frequently Asked Questions
Is Binance safe to use in 2026?
Yes, Binance is one of the safest major cryptocurrency exchanges. It maintains a $1 billion SAFU emergency insurance fund (currently being converted to Bitcoin), publishes Proof of Reserves showing $163 billion in user assets fully backed across 45 crypto assets, stores the majority of funds in cold wallets, and supports 2FA with hardware security keys. In 2025, Binance prevented $6.7 billion in potential scam losses and recovered $48 million in incorrect deposits for users. Since the 2019 breach (fully covered by SAFU), no major security incident has occurred.
What are Binance's trading fees in 2026?
Binance charges 0.10% for both makers and takers on spot trades at the base tier, among the lowest in the industry. Futures fees start at 0.02% maker and 0.05% taker. Paying fees with BNB provides a 25% discount, reducing spot fees to 0.075%. Select FDUSD trading pairs offer zero maker fees. VIP tiers provide further reductions based on 30-day trading volume, going as low as 0.012% maker at VIP 9.
Can I use Binance in the United States?
No, U.S. residents cannot access the global Binance.com platform. They must use Binance.US, a separate entity that restored USD services in early 2026 and introduced zero-fee trading on select pairs. However, Binance.US still has a limited coin selection, no futures or margin trading, and significantly lower liquidity. Many U.S. traders prefer Coinbase or Kraken for a more complete experience.
Is Binance good for beginners?
Binance can work for beginners thanks to its "Lite" mode, Binance Academy educational resources, demo trading with virtual funds, and the Convert feature for simple zero-fee swaps. However, the platform's extensive features and complex interface can be overwhelming for first-time crypto buyers. Complete beginners may find Coinbase or Crypto.com easier to start with before graduating to Binance.
How does Binance compare to Coinbase?
Binance offers lower fees (0.10% vs 0.40%--0.60%), more supported coins (700+ vs 250+), and broader trading options including futures, options, and margin. Coinbase is better for beginners, U.S. users, and those who prioritize regulatory compliance -- it is publicly traded on NASDAQ and holds extensive U.S. licenses. Binance has higher liquidity ($34T annual volume vs ~$1.2T) and a larger user base (300M+ vs 110M+). See our full Coinbase vs Binance comparison for details.
What is the Binance SAFU fund?
The Secure Asset Fund for Users (SAFU) is Binance's $1 billion emergency insurance fund, established in July 2018 and funded by allocating 10% of all spot trading fees. In February 2026, Binance announced it would convert the SAFU from stablecoins to Bitcoin, with a commitment to rebalance to $1 billion if BTC price drops cause the fund to fall below $800 million. The SAFU was first deployed in 2019 to fully reimburse users after hackers stole 7,000 BTC.
What cryptocurrencies does Binance support?
Binance supports over 700 cryptocurrencies including Bitcoin (BTC), Ethereum (ETH), BNB, Solana (SOL), XRP, Cardano (ADA), Dogecoin (DOGE), Avalanche (AVAX), Polkadot (DOT), and hundreds of altcoins. It offers 3,400+ trading pairs across spot, margin, and futures markets. New tokens are regularly added through Binance's listing process, Launchpool events, and the Binance Alpha early access program.
How do I withdraw from Binance?
To withdraw crypto from Binance, navigate to your Wallet, select "Withdraw," choose the cryptocurrency and network, enter the destination wallet address, and confirm the amount. Withdrawal fees are network-dependent (e.g., approximately 0.0002 BTC for Bitcoin). You can reduce fees by selecting cheaper networks like BNB Chain or Polygon where available. Fiat withdrawals are available via bank transfer (SEPA, SWIFT) in supported regions, with fees varying by method and currency.
Our Review Methodology
At Bitcompare, we independently research every platform we review. Our Binance review is based on:
- Fee analysis: We calculated actual trading costs across different tiers and compared to competitors
- Security audit: We verified SAFU fund status, Proof of Reserves, and regulatory licenses
- Feature testing: We evaluated spot, futures, earn products, and the Web3 wallet
- Support testing: We reviewed chat support response times and quality
- Regulatory review: We tracked license status across 20+ jurisdictions
We update this review quarterly or when significant platform changes occur. Our ratings are independent—we don't accept payment for favorable reviews.
Final Verdict
Binance remains the most feature-complete cryptocurrency exchange in 2026. Its combination of the industry's lowest major-exchange fees, 700+ supported coins, comprehensive derivatives trading (up to 125x leverage), a $1 billion SAFU insurance fund, and $163 billion in verified reserves makes it the go-to platform for serious crypto traders worldwide. The exchange processed $34 trillion in trading volume during 2025 and serves over 300 million users globally.
Under Richard Teng's leadership, Binance has transformed from a regulatory outlier into an increasingly compliant institution, securing a landmark ADGM global license in December 2025 and holding registrations in 20+ jurisdictions. The $4.3 billion DOJ settlement is now a chapter in the past, and the exchange has demonstrated consistent improvement in transparency through Proof of Reserves and user protection initiatives.
The main drawbacks remain limited U.S. availability (Binance.US is far less capable than the global platform), a steep learning curve for complete beginners, and inconsistent customer support without phone access. But for traders outside the U.S. who want the best combination of low costs, high liquidity, maximum trading variety, and a comprehensive earn ecosystem, Binance is hard to beat in 2026.
Our rating: 4.5/5 -- Best for active traders seeking the lowest fees, maximum trading options, and the deepest liquidity. Beginners and U.S. residents should consider Coinbase or Kraken as alternatives.


